
##Tools
###PowerTOP
Install PowerTOP with the command:
yum install powertop
Run PowerTOP with the command:
powertop
Note that you will need to run Po werT O P with root privileges to allow the application to do anything useful.
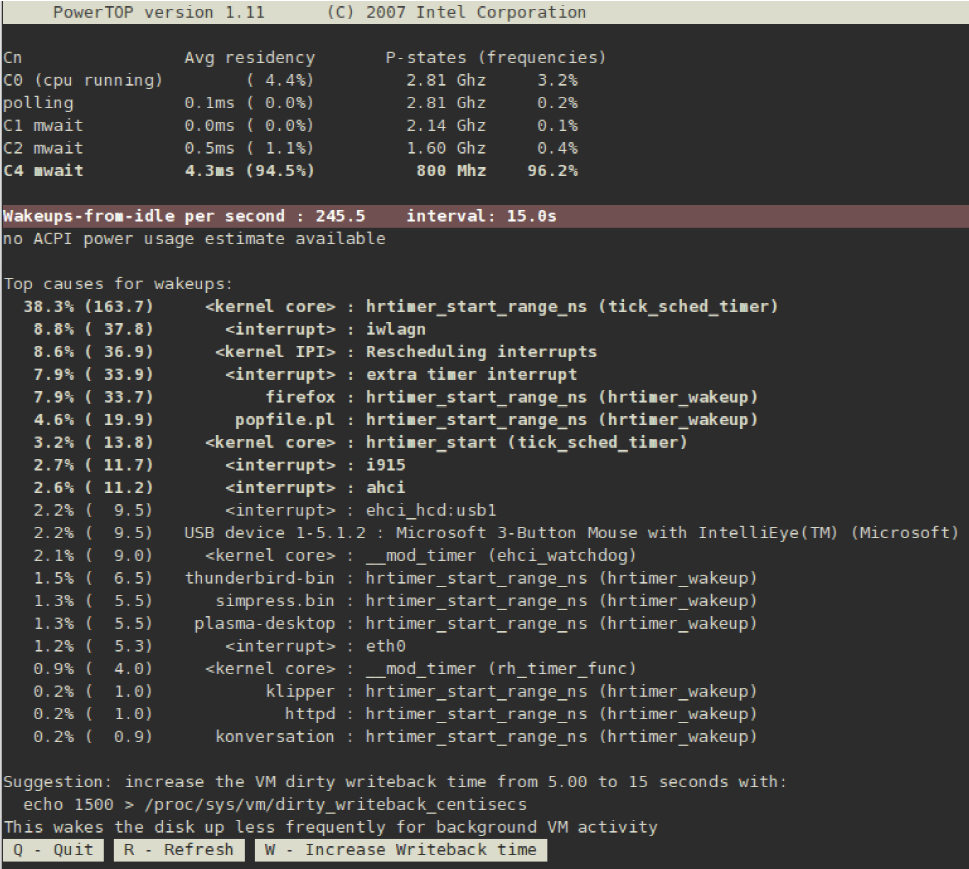
When it runs, PowerTOP gathers statistics from the system and presents you with several important lists of information. At the top is a list of how long your CPU cores have been in each of the available C and P states. The longer the CPU stays in the higher C or P stats the better (C 4 being higher than C 3) and is a good indicator of how well the system is tuned towards CPU utilization. Your goal should be residency of 90% or more in the highest C or P state while the system is idle.
First, identify if this service or application should run at all on this system. If not, simply deactivate it. To turn off a service permanently, run:
chkconfig servicename off
If you need more details about the what the component actually does, run:
ps -awux | g rep componentname
strace -p processid
###Diskdevstat and netdevstat
Diskd evst at and n et d evst at are Syst emT ap tools that collect detailed information about the disk activity and network activity of all applications running on a system. These tools were inspired by PowerTOP, which shows the number of CPU wakeups by every application per second.
Install these tools with Syst emT ap with the command:
yum install systemtap tuned-utils kernel-debuginfo
Run the tools with the command:
diskdevstat
or the command:
netdevstat
Both commands can take up to three parameters, as follows:
diskdevstat update_interval total_duration display_histogram
netdevstat update_interval total_duration display_histogram
update_interval
The time in seconds between updates of the display. D efault: 5
total_duration
The time in seconds for the whole run. D efault: 86 4 0 0 (1 day)
display_histogram
Flag whether to histogram for all the collected data at the end of the run.
The output resembles that of PowerTOP. Here is sample output from a longer diskdevst at run on a Fedora 10 system running KDE 4.2:
PID  UID  DEV  WRITE_CNT  WRITE_MIN  WRITE_MAX  WRITE_AVG  READ_CNT  READ_MIN  READ_MAX  READ_AVG  COMMAND
2789 2903 sda1 854         0.000     120.000    39.836          0    0.000    0.000    0.000    plasma
15494 0 sda1 0 0.000 0.000 0.000 758 0.000 0.012 0.000 0logwatch
15520 0 sda1 0 0.000 0.000 0.000 140 0.000 0.009 0.000 perl
15549 0 sda1 0 0.000 0.000 0.000 140 0.000 0.009 0.000 perl
...
The columns are:
PID the process ID of the application
UID the user ID under which the applications is running
DEV the device on which the I/O took place
WRITE_CNT the total number of write operations
WRITE_MIN the lowest time taken for two consecutive writes (in seconds)
WRITE_MAX the greatest time taken for two consecutive writes (in seconds)
WRITE_AVG the average time taken for two consecutive writes (in seconds)
READ_CNT the total number of read operations
READ_MIN the lowest time taken for two consecutive reads (in seconds)
READ_MAX the greatest time taken for two consecutive reads (in seconds)
READ_AVG the average time taken for two consecutive reads (in seconds)
COMMAND the name of the process
In this example, three very obvious applications stand out:
PID UID DEV WRITE_CNT WRITE_MIN WRITE_MAX WRITE_AVG READ_CNT
READ_MIN READ_MAX READ_AVG COMMAND
2789 2903 sda1 854 0.000 120.000 39.836 0 0.000 0.000 0.000 plasma
2573 0 sda1 63 0.033 3600.015 515.226 0 0.000 0.000 0.000 auditd
2153 0 sda1 26 0.003 3600.029 1290.730 0 0.000 0.000 0.000 rsyslogd
These three applications have a WRITE_CNT greater than 0 , which means that they performed some form of write during the measurement. Of those, plasma was the worst offender by a large degree: it performed the most write operations, and of course the average time between writes was the lowest. Plasma would therefore be the best candidate to investigate if you were concerned about powerinefficient applications.
Use the strace and ltrace commands to examine applications more closely by tracing all system
calls of the given process ID . In the present example, you could run:
strace -p 2789
###Battery Life Tool Kit
BLTK allows you to generate very reproducible workloads that are comparable to real use of a
machine. For example, the office workload writes a text, corrects things in it, and does the same for a spreadsheet. Running BLTK combined with PowerTOP or any of the other auditing or analysis tool allows you to test if the optimizations you performed have an effect when the machine is actively in use instead of only idling. Because you can run the exact same workload multiple times for different settings, you can compare results for different settings.
Install BLTK with the command:
yum install bltk
Run BLTK with the command:
bltk workload options
For example, to run the idle workload for 120 seconds:
bltk -I -T 120
The workloads available by default are:
-I, –idle system is idle, to use as a baseline for comparison with other workloads
-R , –reader simulates reading documents (by default, with Firefox)
-P , –player simulates watching multimedia files from a CD or DVD drive (by default, with mplayer)
-O , –office simulates editing documents with the OpenOffice.org suite Other options allow you to specify:
-a, –ac-ignore ignore whether AC power is available (necessary for desktop use)
-T number_of_seconds, –time number_of_seconds the time (in seconds) over which to run the test; use this option with the idle workload
-F filename, –file filename specifies a file to be used by a particular workload, for example, a file for the player workload to play instead of accessing the CD or DVD drive
-W application, –prog application specifies an application to be used by a particular workload, for example, a browser other than Firefox for the reader workload
BLTK saves the results that it generates in a directory specified in the /etc/bltk.conf
configuration file — by default, ~/.bltk/workload.results.number/. For example, the
~/.bltk/reader.results.002/ directory holds the results of the third test with the reader
workload (the first test is not numbered). The results are spread across several text files. To condense these results into a format that is easy to read, run:
bltk_report path_to_results_directory
The results now appear in a text file named Report in the results directory. To view the results in a terminal emulator instead, use the -o option:
bltk_report -o path_to_results_directory
###Tuned and ktune
Tuned is a daemon that monitors the use of system components and dynamically tunes system
settings based on that monitoring information.
Alongside of tuned we now also offer ktune. Ktune was introduced in Red Hat Enterprise Linux 5.3 as a framework and service to optimize the performance of a machine for a specific use cases.
Install the tuned package and its associated syst emt ap scripts with the command:
yum i nstal l tuned
Installing the tuned package also sets up a sample configuration file at /etc/tuned.conf and
activates the default profile.
Start tuned by running:
service tuned start
To start tuned every time the machine boots, run:
chkconfig tuned on
Tuned itself has additional options that you can use when you run it manually. The available
options are:
-d , --daemon
start tuned as a daemon instead of in the foreground.
-c, --conffile
use a configuration file with the specified name and path, for example, --
conffile= /etc/tuned2.conf. The default is /etc/tuned.conf.
-D , --debug
use the highest level of logging.
####The tuned.conf file
Each plugin has its own section, specified with the name of the plugin in square brackets; for example: [C P UT uni ng ]. Each plugin can have its own options, but the following apply to all plugins:
enabled specifies whether the plugin is enabled or not. The default value is T rue.
verbose specifies whether output should be verbose. If not set for this plugin, the value is inherited from [mai n].
logging specifies the minimum priority of messages to be logged. If not set for this plugin, the value is inherited from [mai n].
A sample config file follows:
[main]
interval=10
pidfile=/var/run/tuned.pid
logging=info
logging_disable=notset
# Disk monitoring section
[DiskMonitor]
enabled=True
logging=debug
# Disk tuning section
[DiskTuning]
enabled=True
hdparm=False
alpm=False
logging=debug
# Net monitoring section
[NetMonitor]
enabled=True
logging=debug
####Tuned-adm
Often, a detailed audit and analysis of a system can be very time consuming and might not be worth the few extra watts you might be able to save by doing so. Previously, the only alternative was simply to use the defaults. Therefore, Red Hat Enterprise Linux 6 includes separate profiles for specific use cases as an alternative between those two extremes, together with the tuned-adm tool that allows you to switch between these profiles easily at the command line.
To list all available profiles and identify the current active profile, run:
tuned-adm list
To only display the currently active profile, run:
tuned-adm active
To switch to one of the available profiles, run:
tuned-adm profile profile_name
for example:
tuned-adm profile server-powersave
To disable all tuning:
tuned-adm off
When you first install tuned , the default profile will be active. Red Hat Enterprise Linux 6 also includes the following predefined profiles:
-
default the default power-saving profile. It has the lowest impact on power saving of the available profiles and only enables CPU and disk plugins of
tuned. - desktop-powersave
- server-powersave
- laptop-ac-powersave
- laptop-battery-powersave
- spindown-disk
- throughput-performance
- latency-performance
- enterprise-storage
###DeviceKit-power and devkit-power
DeviceKit-power provides a daemon, an API, and a set of command-line tools.Each power source
on the system is represented as a device, whether it is a physical device or not. For example, a laptop battery and an AC power source are both represented as devices.
You can access the command-line tools with the devkit-power command and the following
options:
–enumerate, -e displays an object path for each power devices on the system, for example:
/org/freedesktop/DeviceKit/power/devices/line_power_AC
/org/freedesktop/UPower/DeviceKit/power/battery_BAT0
–dump, -d displays the parameters for all power devices on the system.
–wakeups, -w displays the CPU wakeups on the system.
–monitor, -m monitors the system for changes to power devices, for example, the connection or disconnection of a source of AC power, or the depletion of a battery. Press Ctrl+C to stop monitoring the system.
–mo ni to r-d etai l monitors the system for changes to power devices, for example, the connection or disconnection of a source of AC power, or the depletion of a battery. The –mo ni to rd etai l option presents more detail than the –mo ni to r option. Press C trl +C to stop monitoring the system.
–show-info object_path, -i object_path
displays all information available for a particular object path. For example, to obtain
information about a battery on your system represented by the object path
/org/freedesktop/UPower/DeviceKit/power/battery_BAT0 , run:
devkit-power -i
/org/freedesktop/UPower/DeviceKit/power/battery_BAT0
###GNOME Power Manager
GNOME Power Manager is a daemon that is installed as part of the GNOME desktop.
GNOME Power Manager also allows you to configure some basic power management settings. To
access these settings, click the GNOME Power Manager icon in the system tray, then click
Preferences
The Power Management Preferences screen contains two tabs:
* On AC Power
* General
On a laptop, Power Management Preferences will contain a third tab:
* On Battery Power
###Other means for auditing Red Hat Enterprise Linux 6 offers quite a few more tools with which to perform system auditing and analysis. Most of them can be used as a supplementary sources of information in case you want to verify what you have discovered already or in case you need more in-depth information on certain parts. Many of these tools are used for performance tuning as well. They include:
vmstat
vmstat gives you detailed information about processes, memory, paging, block I/O, traps,
and CPU activity. Use it to take a closer look at what the system overall does and where it is
busy.
iostat
iostat is similar to vmstat , but only for I/O on block devices. It also provides more verbose
output and statistics.
blktrace
blktrace is a very detailed block I/O trace program. It breaks down information to single
blocks associated with applications. It is very useful in combination with diskdevstat .
refer (https://access.redhat.com/documentation/en-US/Red_Hat_Enterprise_Linux/6/html/Power_Management_Guide/index.html)